Is your app growing, or just not dead yet?
Most analytics tools show you what users clicked. We built retention analytics for people who'd rather cut straight to the answers than build a dashboard: daily active user forecasts, cohort analysis, and churn alerts, built for teams without a data analyst.
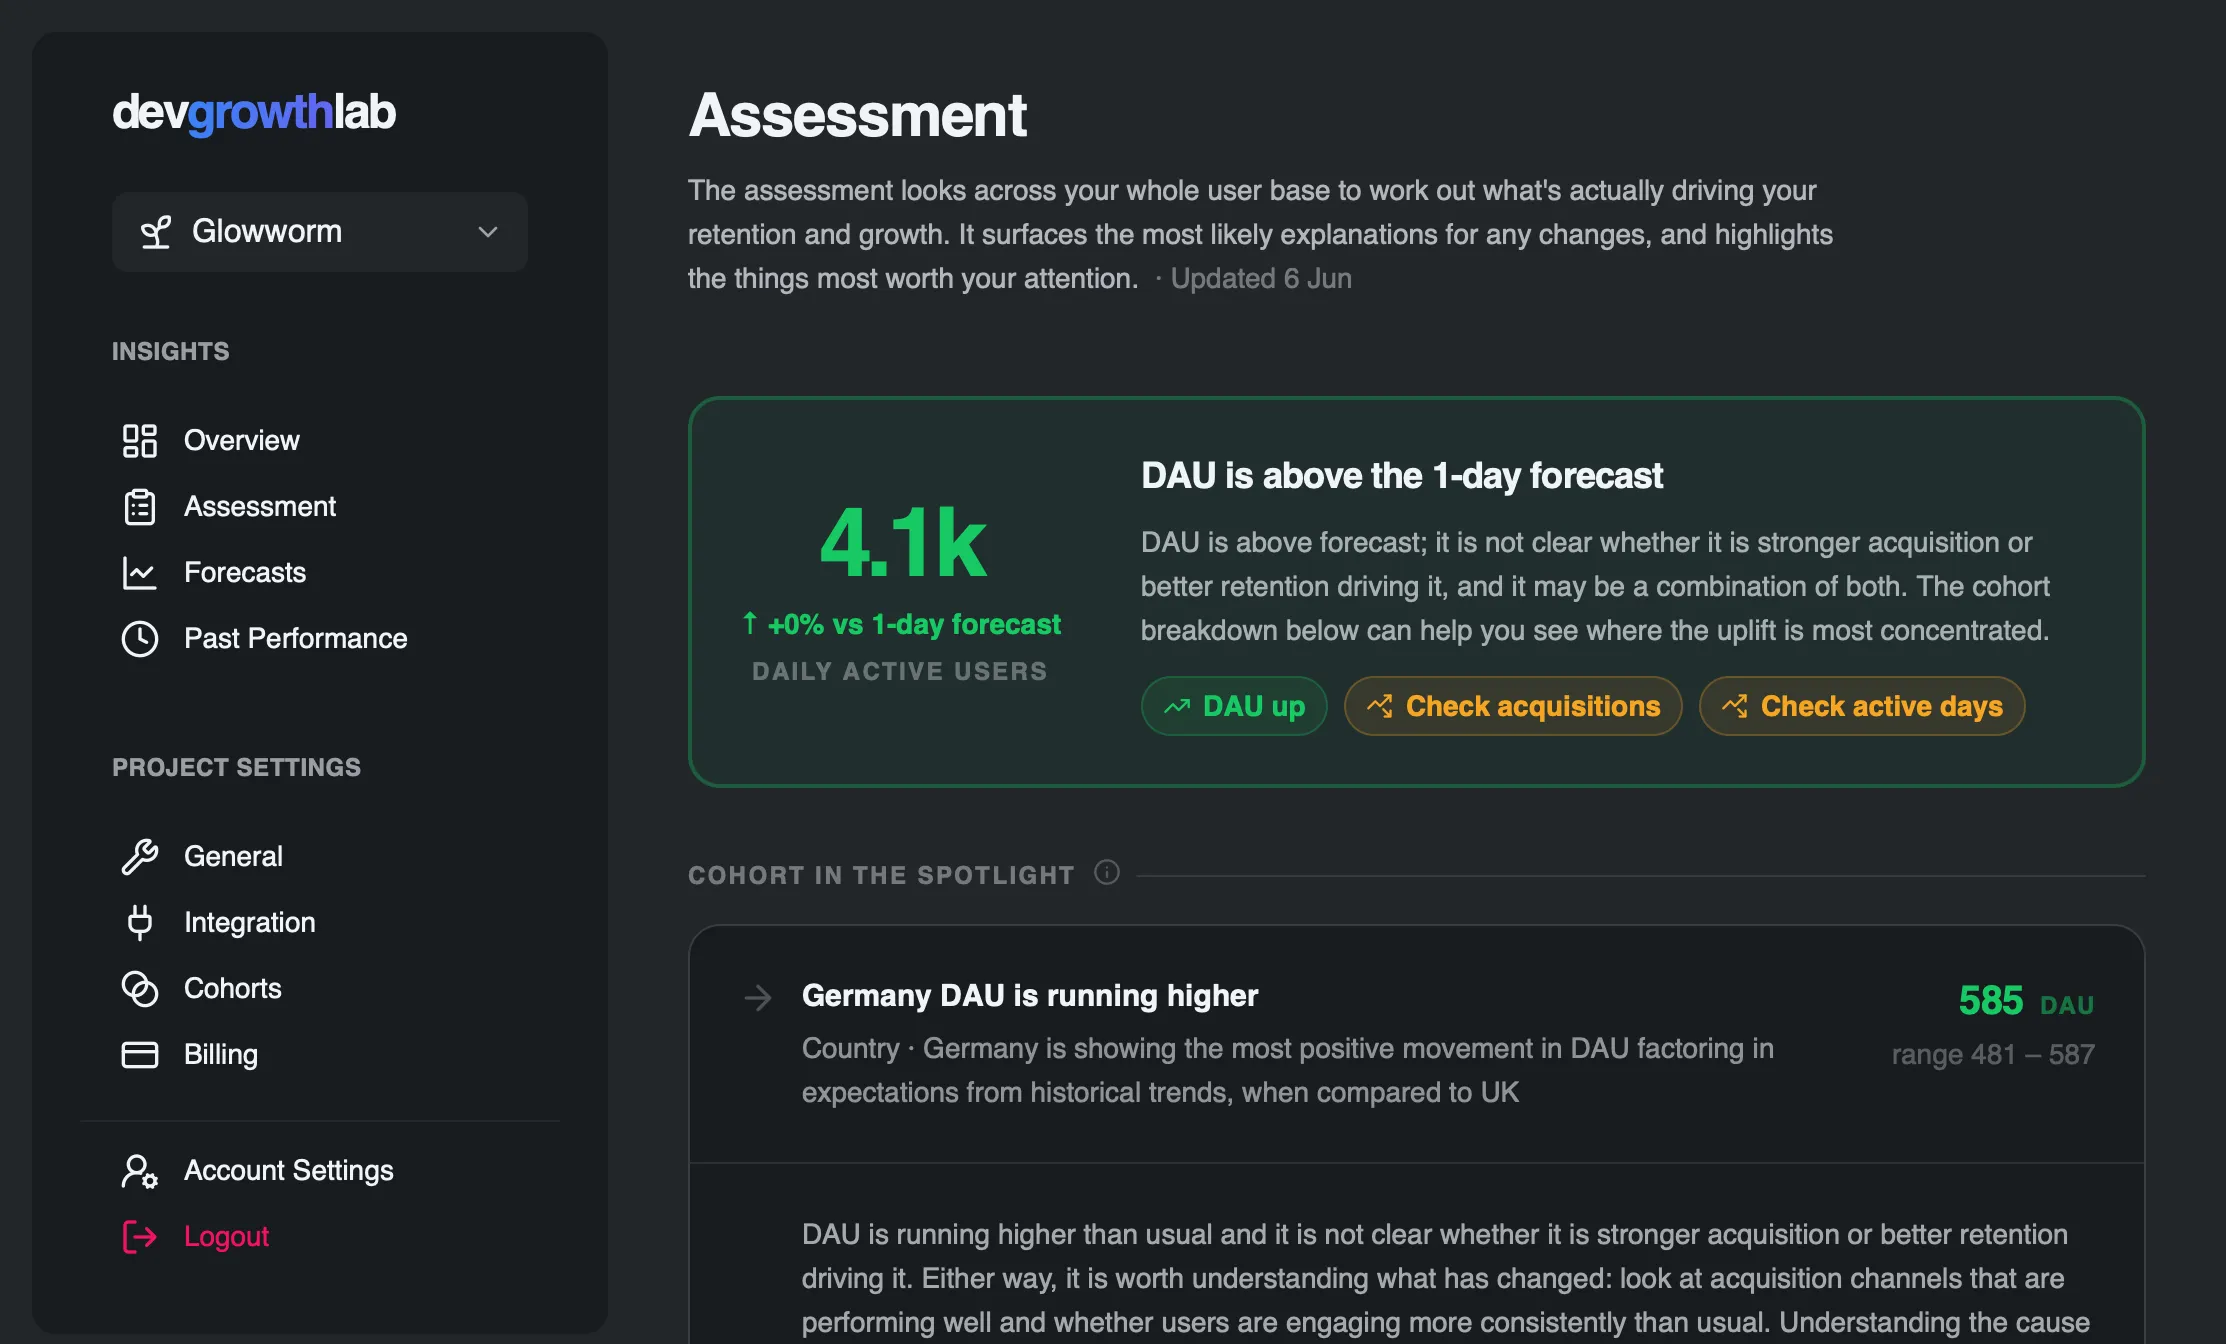
New alert
Daily active users in the Germany cohort are increasing faster than forecast
See the live dashboard for the project this alert actually fired on.
View the demo
Forecast, don't guess
Built for the 10 minutes a week you have, not the afternoon you don't
Other analytics tools assume someone on your team has time to dig through dashboards. We do the digging and hand you the analysis: "The number of daily active users has started trending down; here's the things we'd recommend you check first."
Cohort analysis, done for you
Alerts land in your inbox whenever activity moves outside the forecasted range
A dashboard to check, without having to study it
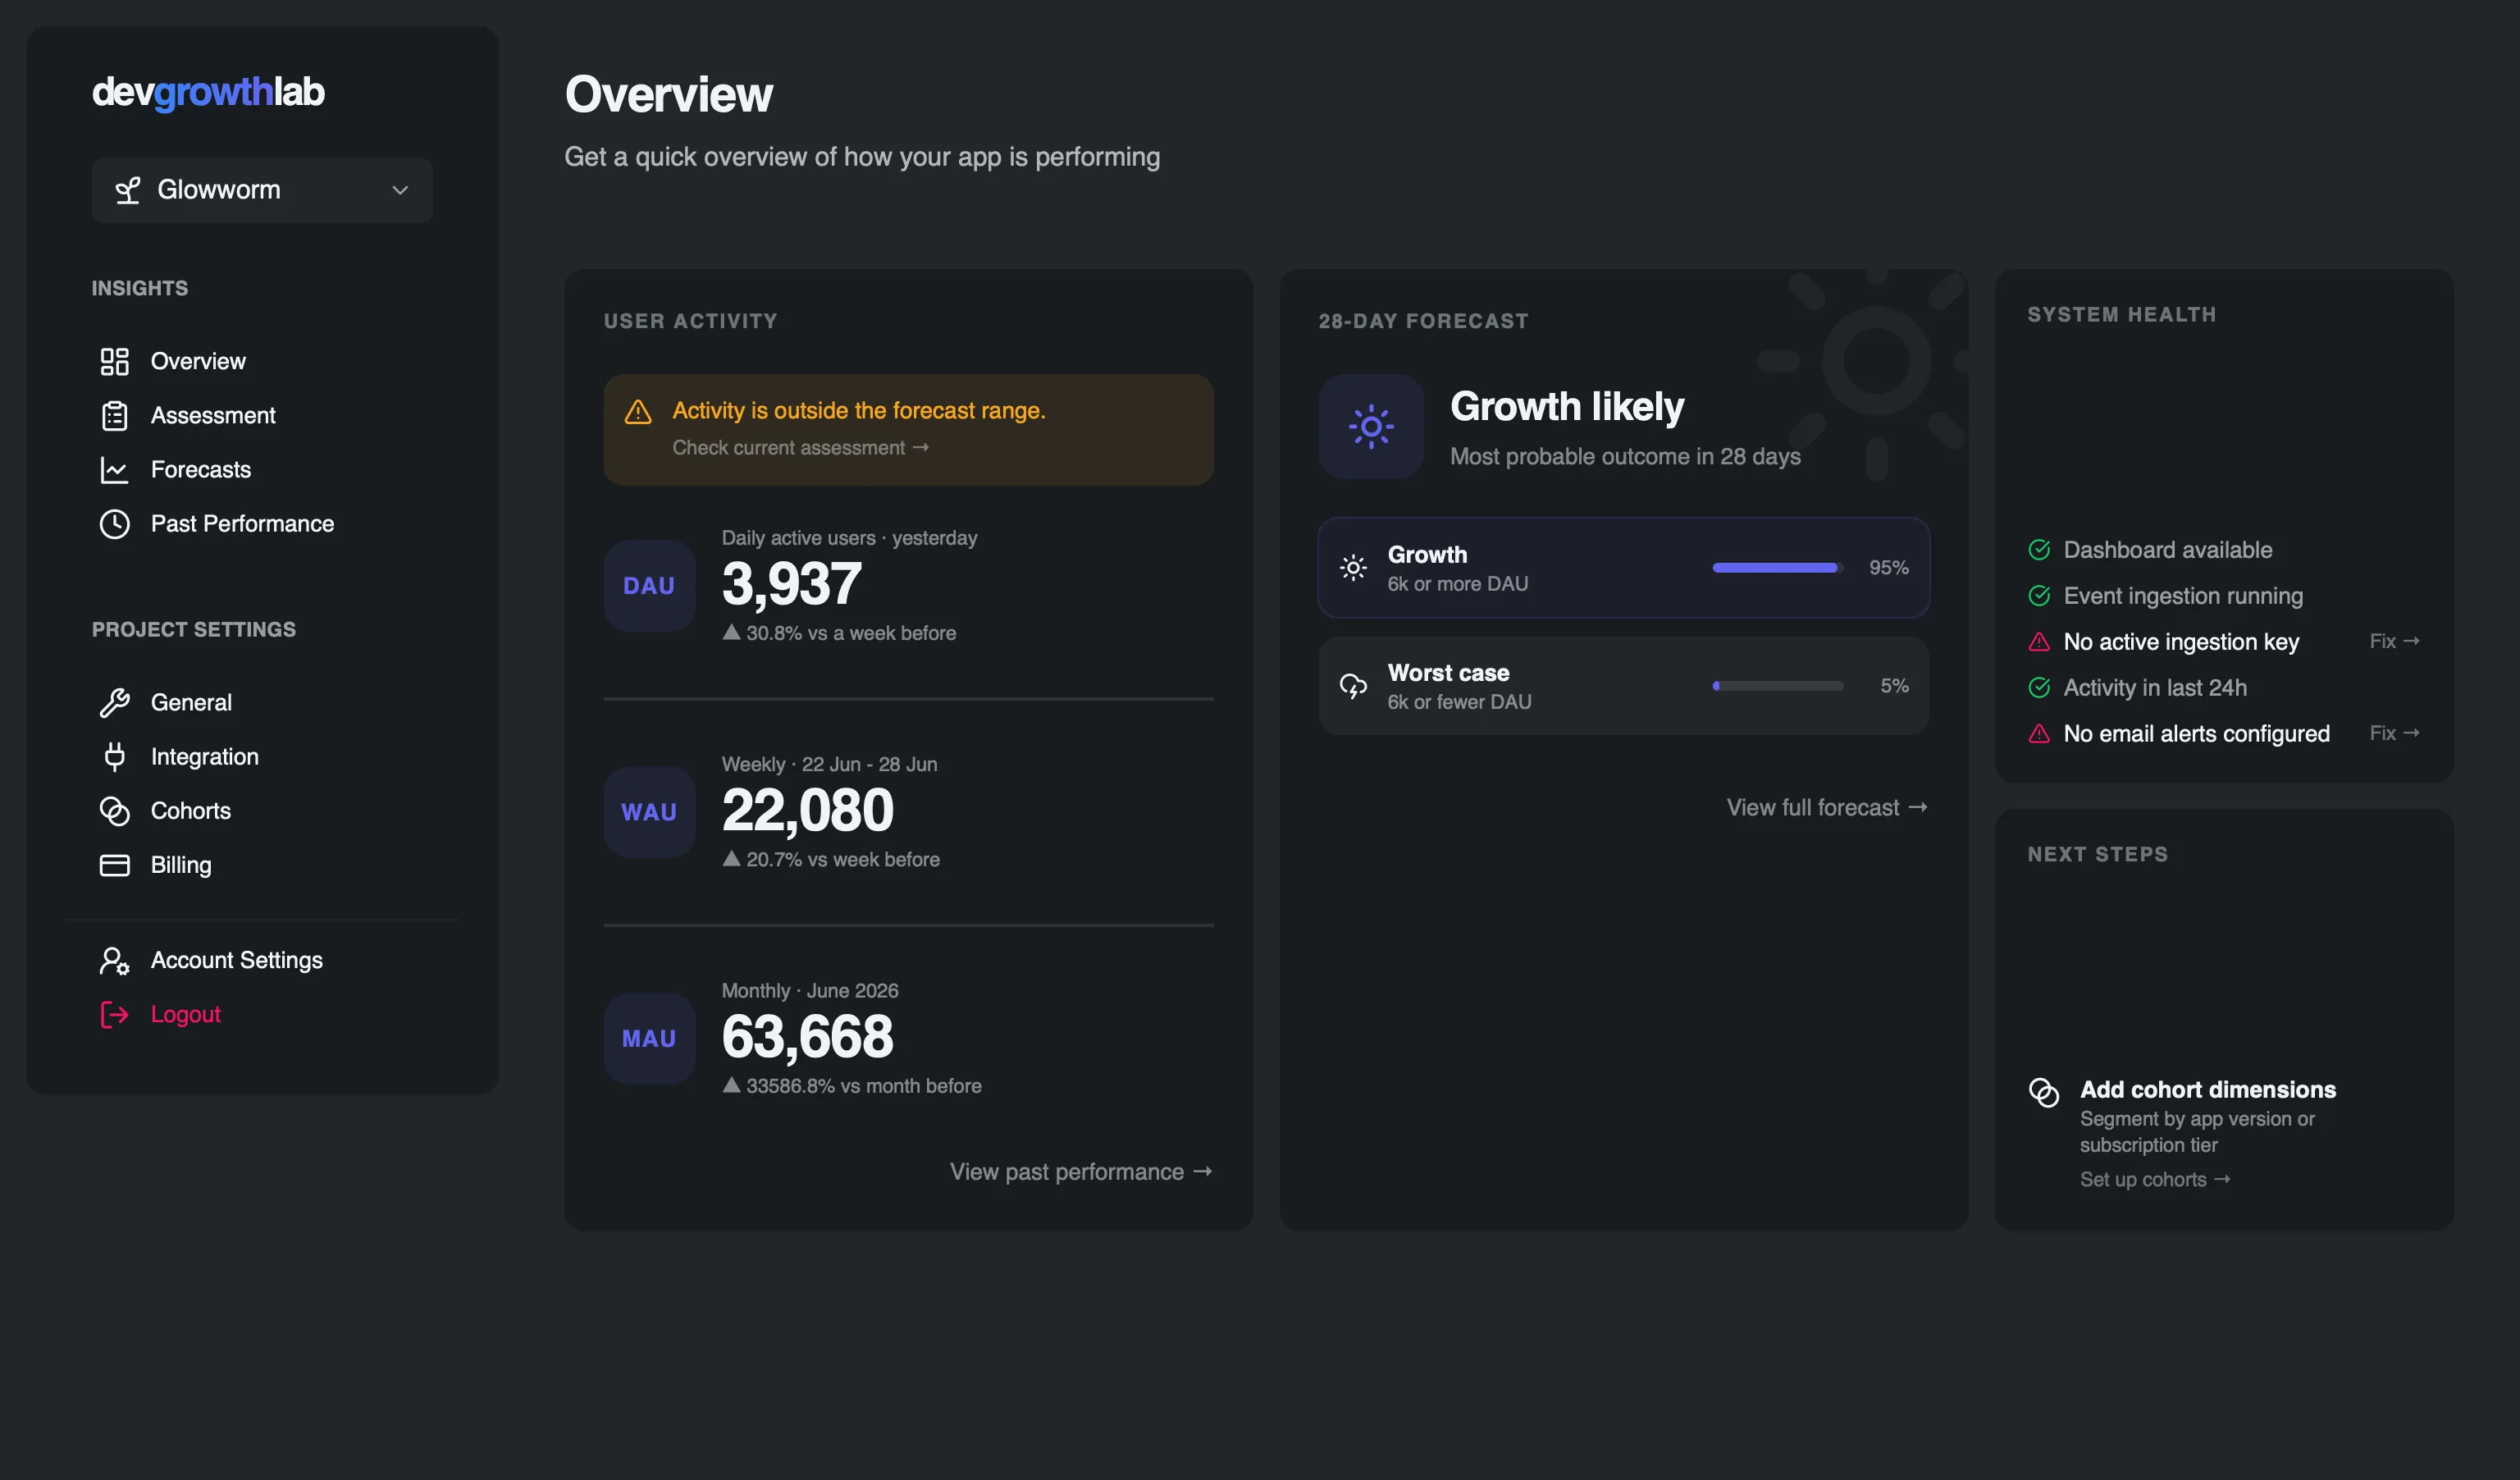
Get an overview that shows you what matters most
From API call to analysis, no analyst required
No dashboards to configure, no data pipeline to build. One API call, and devgrowthlab starts modelling your retention right away.
1. Send one API call
A singlePOSTwhen someone opens your app. No SDK, no client-side tracking.
2. We model it automatically
Everything gets modelled the moment your data arrives, no analyst, no spreadsheets, nothing else to set up.
3. You get the analysis
Check in whenever you like, or don't, we'll get in touch when it's worth your attention.
val info = Info( cohorts = mapOf( "App Version" to "v1.3.2", "Ad Group" to "Summer Campaign" ),)val service = Retrofit.Builder() .baseUrl("https://project.devgrowthlabprojects.com/ingest") .addConverterFactory(jsonConverterFactory) .build() .create(DevgrowthlabService::class.java)service.sendInfo(info)Other tools
devgrowthlab
Event logs you have to interpret yourself
Automatic analysis every day, like clockwork, no manual work involved
Complex dashboards that require setting up and configuration
Dashboards preconfigured and ready to go when you are
You spot problems by checking often and checking manually
Automated alerts when things don't match the forecasts
Billed per event, without any limits by default
Billed as packages, with sensible limits based on daily active users